
Why Local Businesses Need to Pay Attention to Analytics
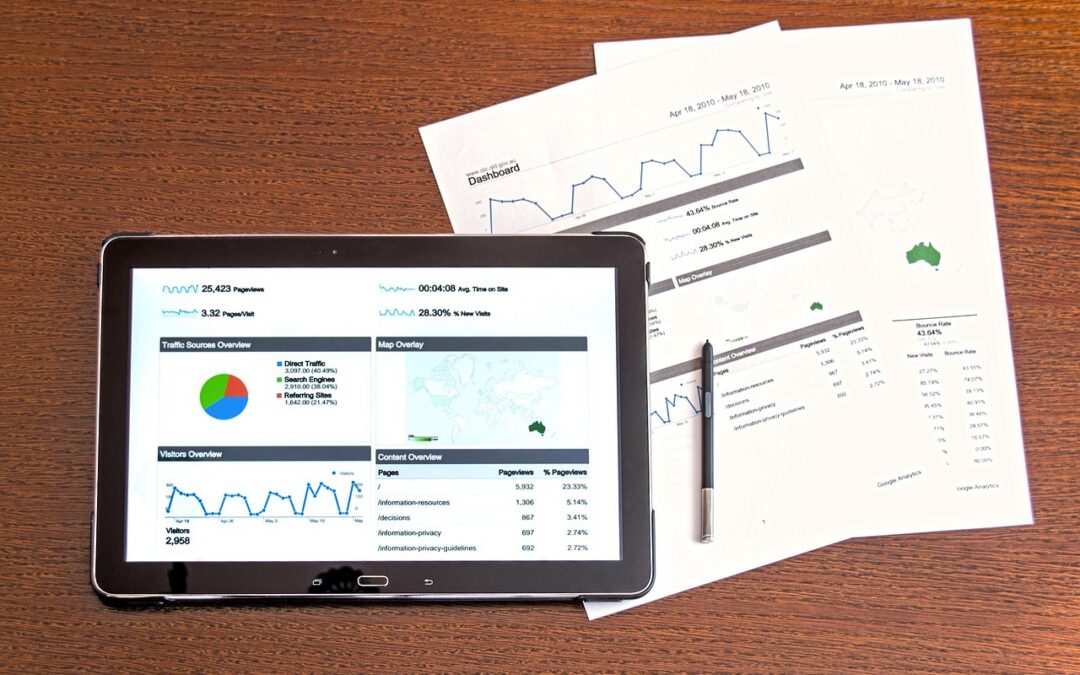
Most local business owners are collecting data every day and not looking at any of it. Your website tracks every visit. Your Google Business Profile tracks every call and direction request.
Your social media platforms log every post, click, and follower gained or lost.
All of that data is free, and most of it goes completely unused.
That’s a problem. The businesses that look at their numbers make better decisions. They spend marketing dollars where they actually work.
They stop doing things that aren’t helping.
And they catch problems before those problems cost them customers.
What Is Analytics, and Why Does It Matter for Local Businesses?
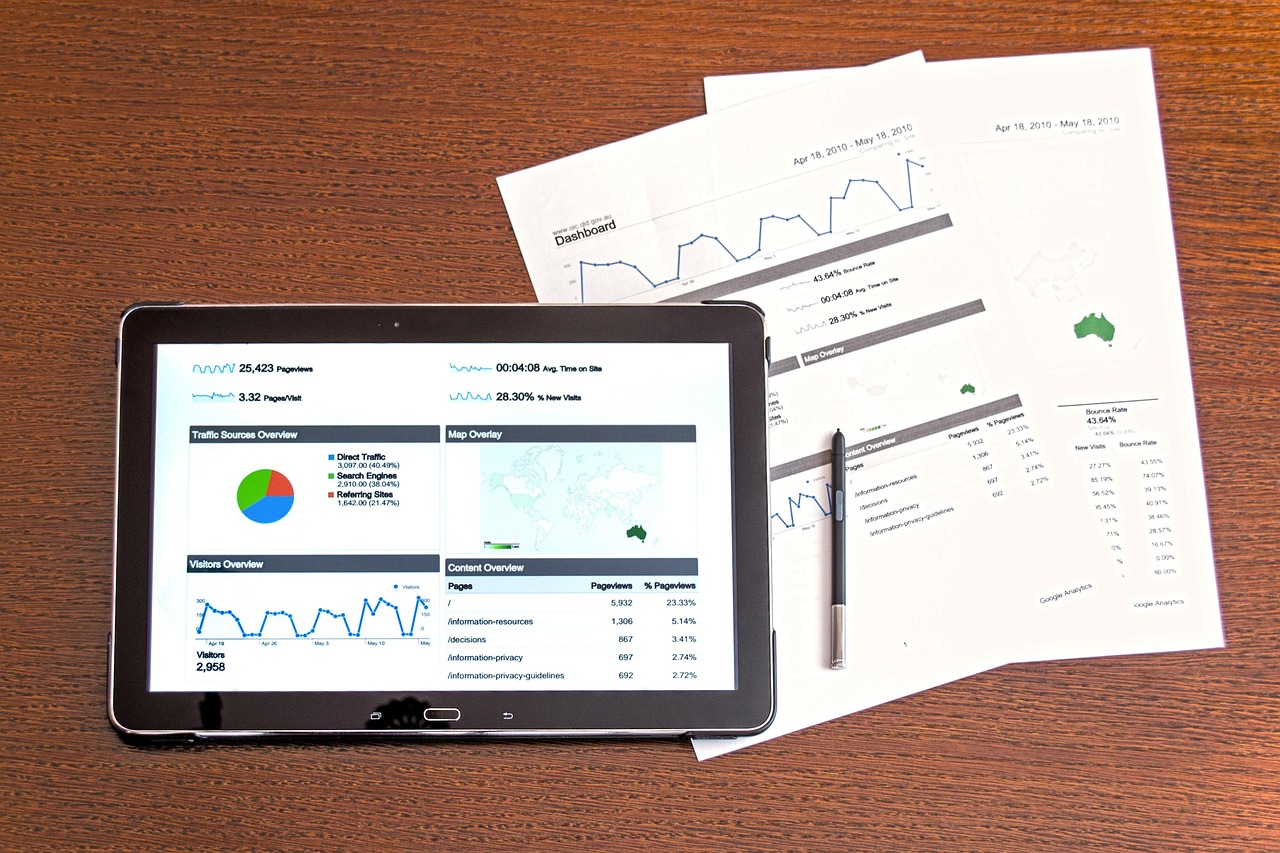
Analytics is just the practice of collecting and reviewing data about how your business is performing online.
For a local business in the Chicagoland area, that might mean checking how many people found your website by searching “Naperville HVAC company” last month, or which day of the week your Google Business Profile gets the most calls, or whether people who visit your services page are actually contacting you or bouncing off.
None of this requires a data science background. The tools are free. The numbers are already being collected.
You just have to look at them.
According to a survey by Clutch, nearly 40% of small businesses with a website do not use analytics tools to track performance. If you’re in that group, your competitors who do check their numbers have a real edge over you.
Google Analytics 4: Your Website’s Report Card

Google Analytics 4, or GA4, is the standard tool for tracking website traffic. It replaced Universal Analytics in July 2023 and is now the default for all new Google Analytics accounts. It’s free and connects directly to your site in about 20 minutes.
Once it’s set up, you can see how many people visited your site, where they came from (search, social media, direct), which pages they looked at, and how long they stayed.
For a local business, the most useful reports to check monthly are:
- Traffic by channel: how many visitors came from Google search vs. social media vs. direct
- Top pages: which pages are people landing on first, and which ones are they leaving from
- Geographic data: are visitors actually in your service area, or are you pulling traffic from places you don’t serve?
- Conversions: are people who visit your contact or booking page following through, or dropping off?
You don’t need to check every report. Pick three to four numbers you care about and look at them once a month. That’s enough to spot trends.
Google Business Profile Insights

If you have a Google Business Profile (the listing that shows up when someone searches your business name), you have access to data that most local business owners never look at.
Your GBP dashboard shows how many people searched for your business by name vs. by category (“plumber near me”). It shows how many people clicked to call you, requested directions, or visited your website directly from the listing.
This data tells you something direct: it shows whether your Google presence is actively sending you customers, or just sitting there.
Log into your Google Business Profile and check the last 28 days of insights. If your “calls” number is low but your “views” number is high, that’s a sign people are finding you but something is stopping them from calling. Could be your hours, your photos, or your reviews.
Social Media Analytics: What’s Worth Tracking
Every major social platform (Facebook, Instagram, X, LinkedIn) has built-in analytics. Most local businesses never open them.
You don’t need to track everything. For a local business, the numbers that matter are reach (how many unique people saw your posts), engagement rate (how many of them did something), and link clicks (how many went to your website).
Look at these once a month. See which types of posts get the most engagement. Do more of those.
Stop doing the ones that get no response.
| Platform | Where to Find It | What to Check |
|---|---|---|
| Meta Business Suite | Reach, post engagement, page likes over time | |
| Professional dashboard in-app | Reach, profile visits, link clicks in bio | |
| Google Business | google.com/business | Searches, calls, direction requests, photo views |
| Website | Google Analytics 4 | Sessions, top pages, traffic sources, conversions |
How to Use the Data to Make Better Decisions
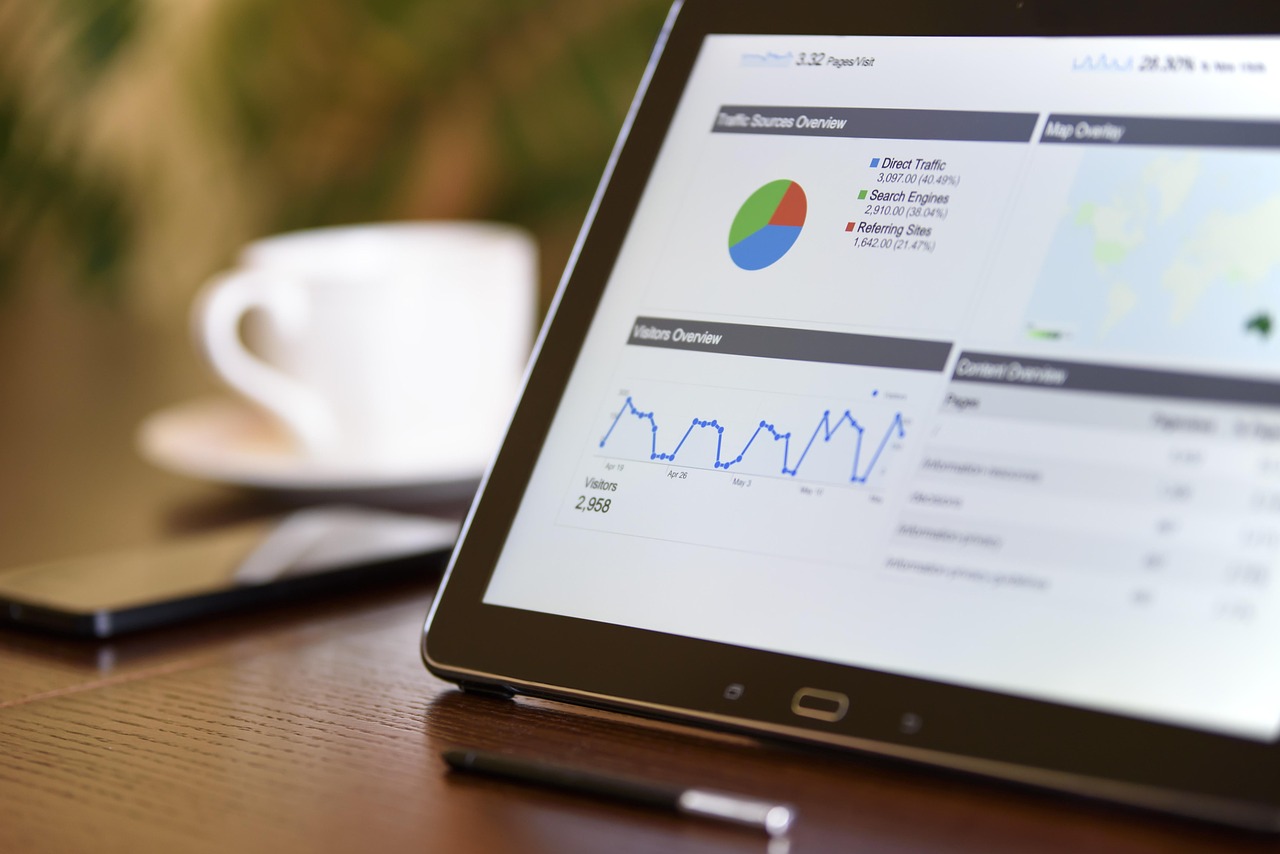
Analytics only matters if you do something with it.
Say your GA4 data shows that 70% of your website visitors are on mobile, but your site loads slowly on phones. That’s a clear fix.
Or your GBP shows 500 people saw your listing last month but only 12 clicked to call. That’s a signal your listing needs better photos or a stronger description.
A roofer in Aurora who checks analytics monthly will notice when their summer traffic drops off before their competitors do. A restaurant in Oak Park can see which neighborhood their Google searchers are coming from and run a targeted offer for that zip code.
The businesses that do this aren’t doing anything fancy. They’re just paying attention to information that’s already available to them.
Start Small: Your Monthly Analytics Routine
You don’t need to hire an analyst or buy expensive software. A 20-minute monthly routine is enough to catch what matters.
- Check Google Analytics: how many visitors, where from, which pages
- Check Google Business Profile: calls, direction requests, views this month vs. last month
- Check your best social platform: which posts worked, which didn’t
- Write down one thing you’ll do differently next month based on what you saw
That last step is the one most people skip. The data is only useful if it changes what you do next.
Not Sure What Your Numbers Are Telling You?
We help local businesses across Chicagoland make sense of their analytics and use that data to get more customers. No dashboards, no jargon, just straight answers.